Dynatrace: All-in-one monitoring - simple, automatic, AI-supported
Dynatrace simplifies performance monitoring of both complex cloud and native environments. Dynatrace learns the normal behavior of your application and can proactively identify root causes and potential impacts on the customer environment and its effects.
Discover what Dynatrace has to offer:
Dynatrace Application Security
Dynatrace looks at security from a DevOps perspective with Runtime Application Self-Protection ("RASP"). With an automated check of the app environments, anomalies and vulnerable components are detected at runtime. DevOps becomes DevSecOps.
Real-time security testing in the application context
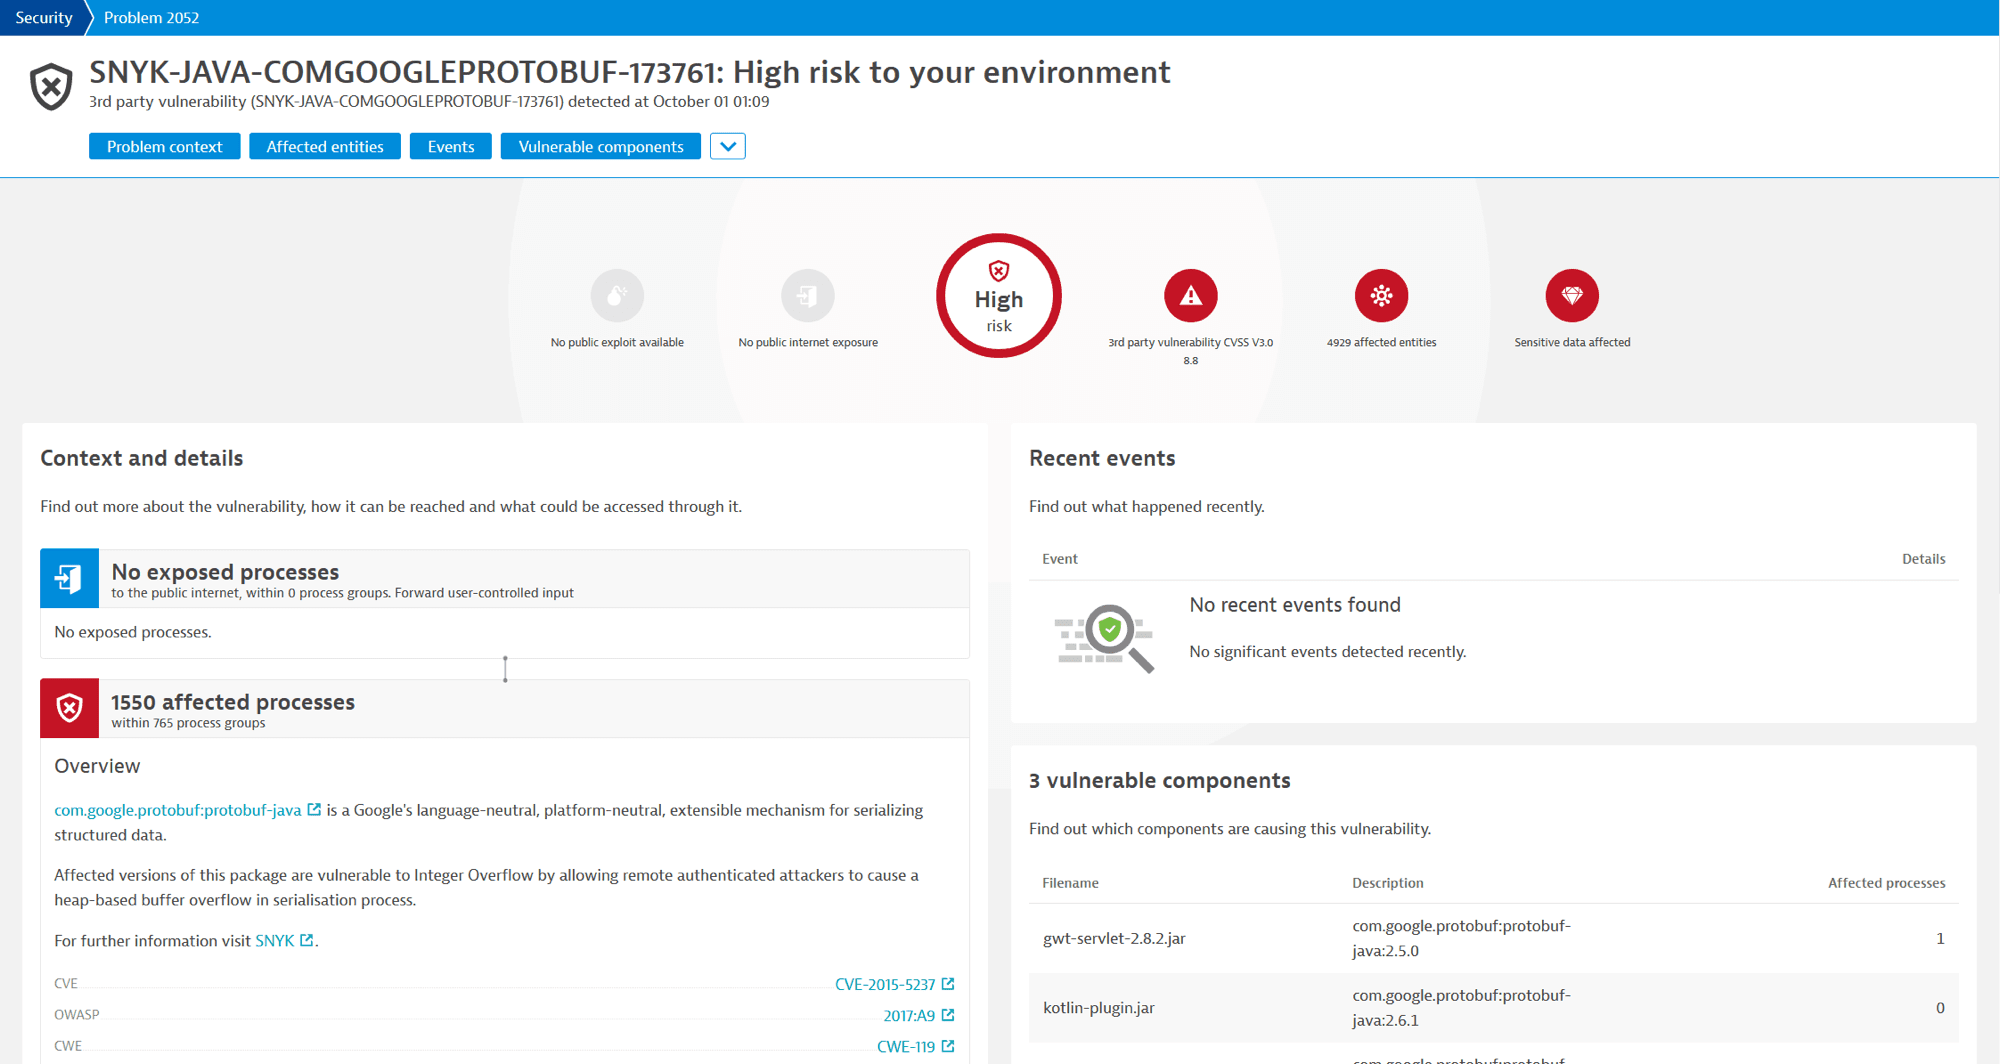
Agile development methods and the use of dynamic cloud and container environments pose major challenges to traditional approaches to application security: no rollout before security release. This complicates the shift-left in DevOps. Dynatrace, on the other hand, already knows the application environments and uses the Application Security module to check whether the discovered vulnerability is exposed or already protected.
With Application Security from Dynatrace you get:
• A comparison with an up-to-date database of vulnerabilities with risk assessment according to the Common Vulnerability Scoring System (CVSS).
• A dependency detection to vulnerable components.
• Fewer false positives despite shorter release cycles.
• An assessment of business risks based on vulnerability and criticality.
Dynatrace Business Analytics
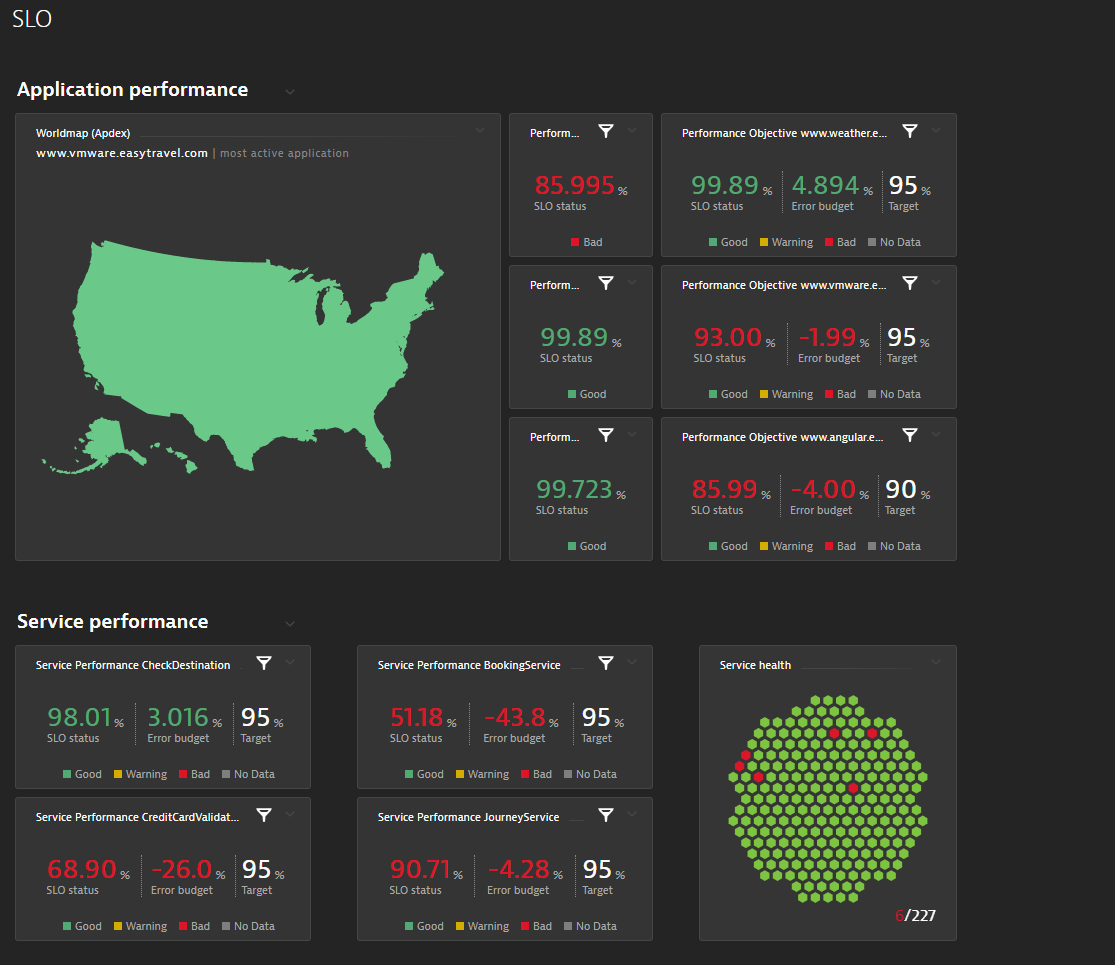
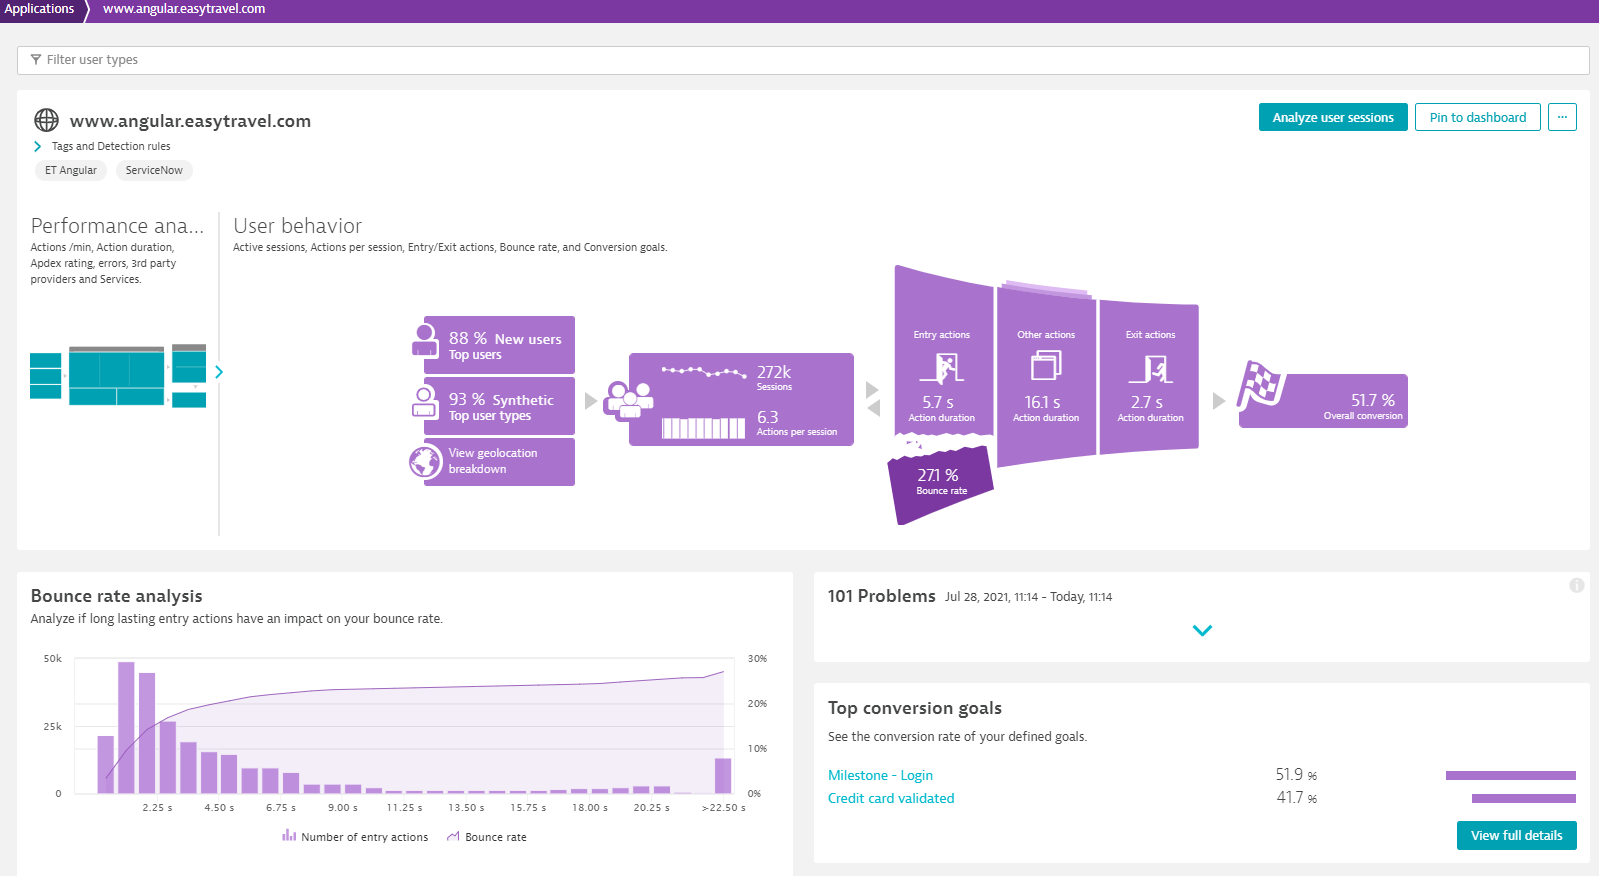
With Dynatrace Business Analytics, you define your business KPIs and make them measurable. With consolidated real-time insights from web, mobile and IoT channels, you can better manage your business goals for success.
Putting an end to data silos: with BizDevOps to success.
The big advantage in using a common data set for business and IT teams is that the perspectives of both teams are taken and viewed in context. In this way, user behaviour can be correlated with the underlying applications and corrected if necessary. In addition, the data obtained can be enriched with further metrics from popular business analytics tools.
With Business Analytics from Dynatrace you know:
• which IT issues could have the greatest impact on your business numbers and therefore need to be resolved in a prioritised manner,
• what impact new application releases will have on your business performance,
• whether service level objectives (SLOs) are being met.
Dynatrace Cloud Automation
With Dynatrace Cloud Automation, you save the manual effort of monitoring and evaluation testing and instead use an AI-driven solution for automated orchestration across the entire DevOps cycle - scalable, efficient and reliable.
Shift-Left the quality, Shift-Right the reliability of your app.
Through an automated inventory of all your app versions, you understand the behaviour and state of your app. This allows you to optimise your code at early stages of development and avoid quality degradation. You can also automate the entire app lifecycle by triggering rollbacks or new release workflows - for example, using Keptn, which integrates completely with Dynatrace.
Cloud Automation from Dynatrace also allows you to:
• Automated validation of SLOs through quality gates,
• monitor compliance with SLAs,
• an automated triggering of incident management workflows and a subsequent evaluation of the implemented solution,
• easier application of DevOps and SRE best practices.
Dynatrace Digital Experience Monitoring (DEM)
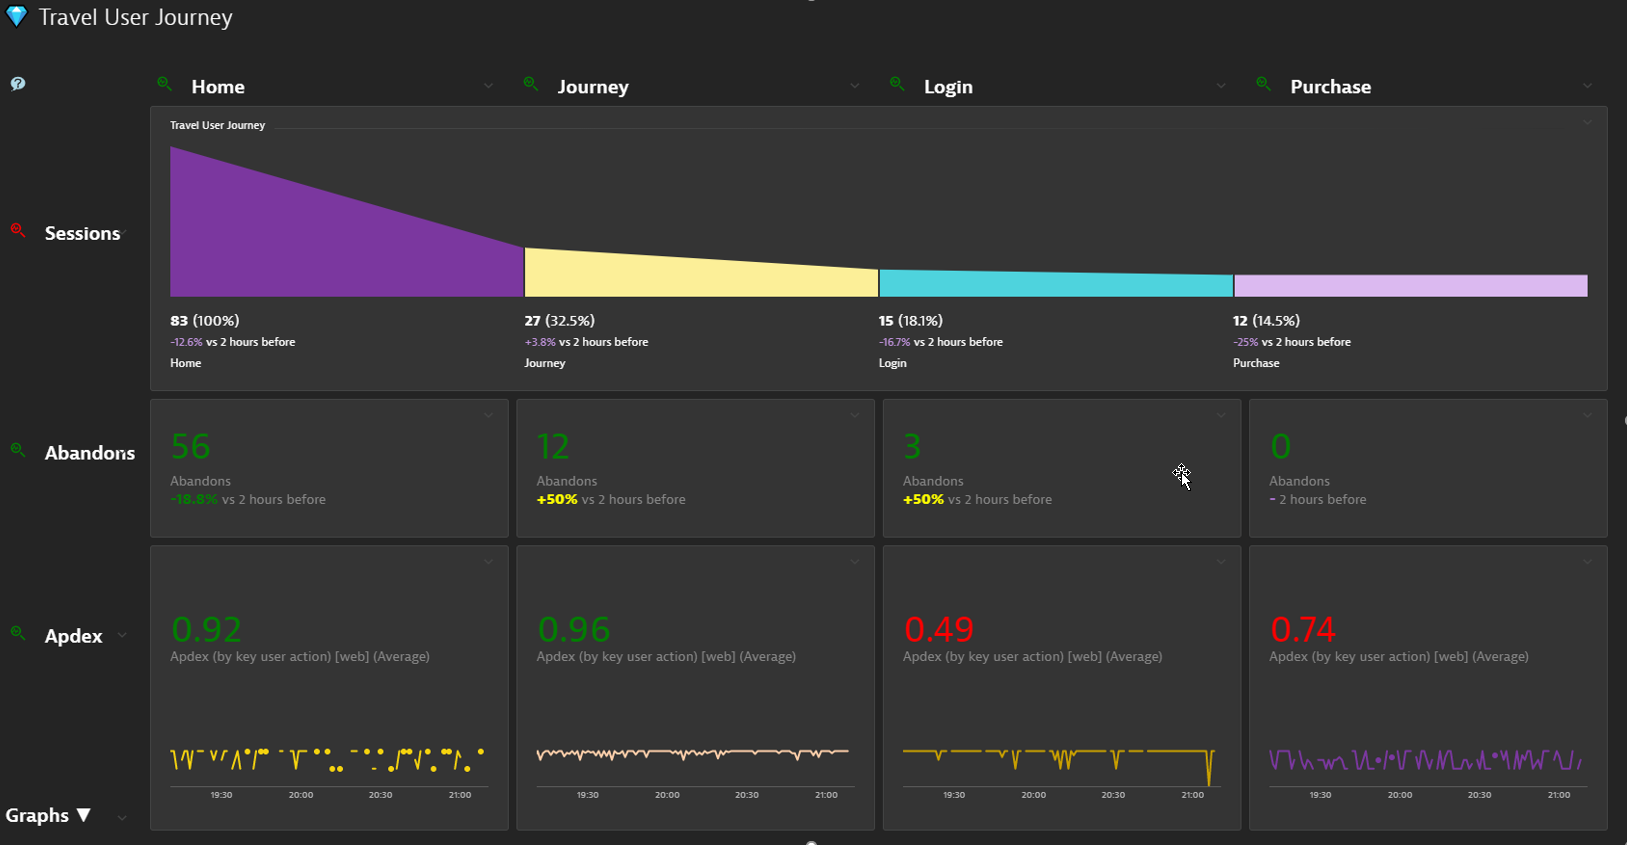
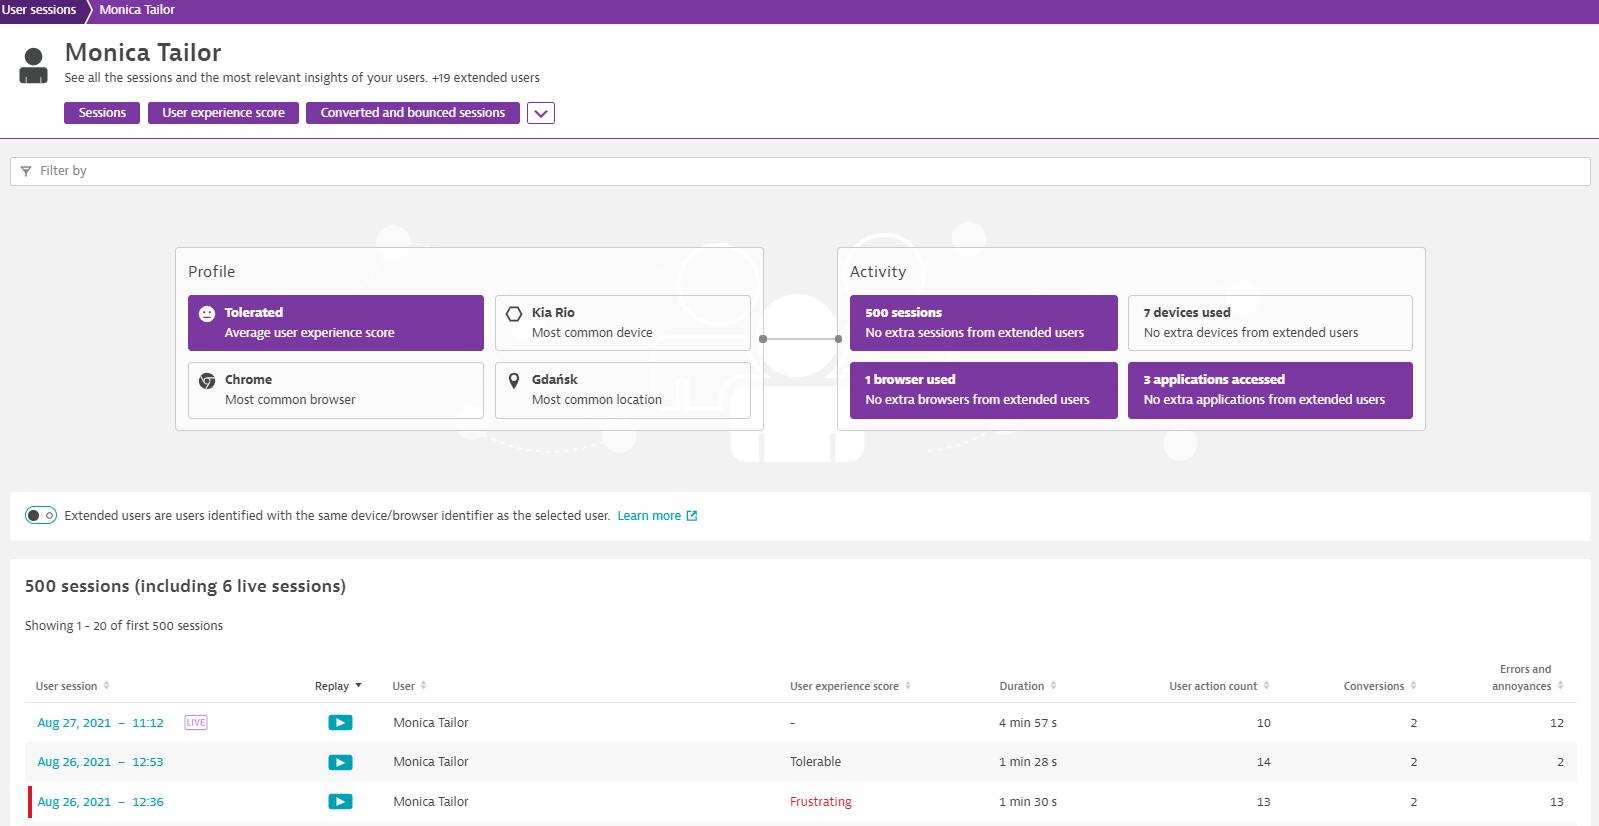
With Dynatrace Digital Experience Monitoring, you ensure that every application is available, functional, fast and efficient across every channel, including mobile, web, IoT and APIs.
Ensure a positive user experience
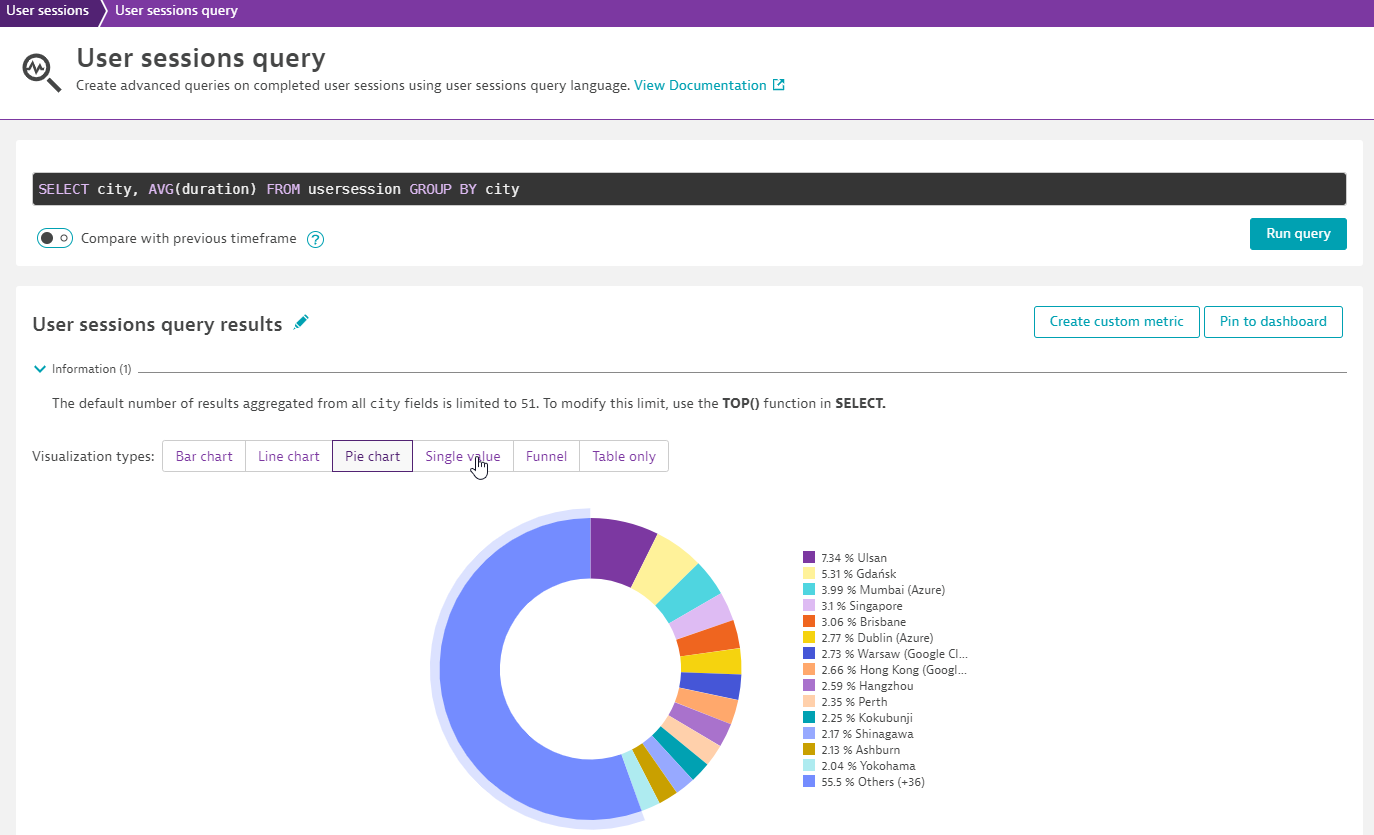
With end-user monitoring, you immediately know how they are moving through their application, when problems are occurring and how to fix them quickly. You can also view each user session as a video to see the experience through the eyes of the end user. In addition, synthetic monitoring can detect problems before they affect your customers.
With Dynatrace Digital Experience Monitoring you can:
• monitor and analyse end-user experience,
• prevent problems before users are affected,
• optimise the user experience by analysing the session,
• identify and resolve issues that impact the end user.
Dynatrace Infrastruktur Monitoring
Intelligent monitoring of cloud and hybrid environments with continuous automated discovery of hosts, VMs, serverless, cloud services, containers and Kubernetes, networks, devices, logs, events and more - all in context and with accurate, AI-powered responses to issues.
Real-time monitoring for the entire infrastructure
Automatically monitor your entire infrastructure, including cloud, hybrid, containers, VMs, network, servers, storage, logs and more. Get detailed insights into PaaS and container technologies such as AWS, Azure, GCP, Kubernetes, Openshift and Cloud Foundry.
You also get direct access to the log content of all your business-critical processes, allowing you to create custom log metrics for smarter and faster troubleshooting.
AI support continuously monitors your entire infrastructure to detect anomalies and deliver accurate responses prioritised by business impact. Increase your team's productivity and focus on what matters - proactivity, innovation and business results.
With Infrastructure Monitoring from Dynatrace you get:
• Hybrid Cloud Observability
• Fault Domain Isolation
• Serverless, Container and Pod Monitoring
• AI Monitoring
• Log-Monitoring
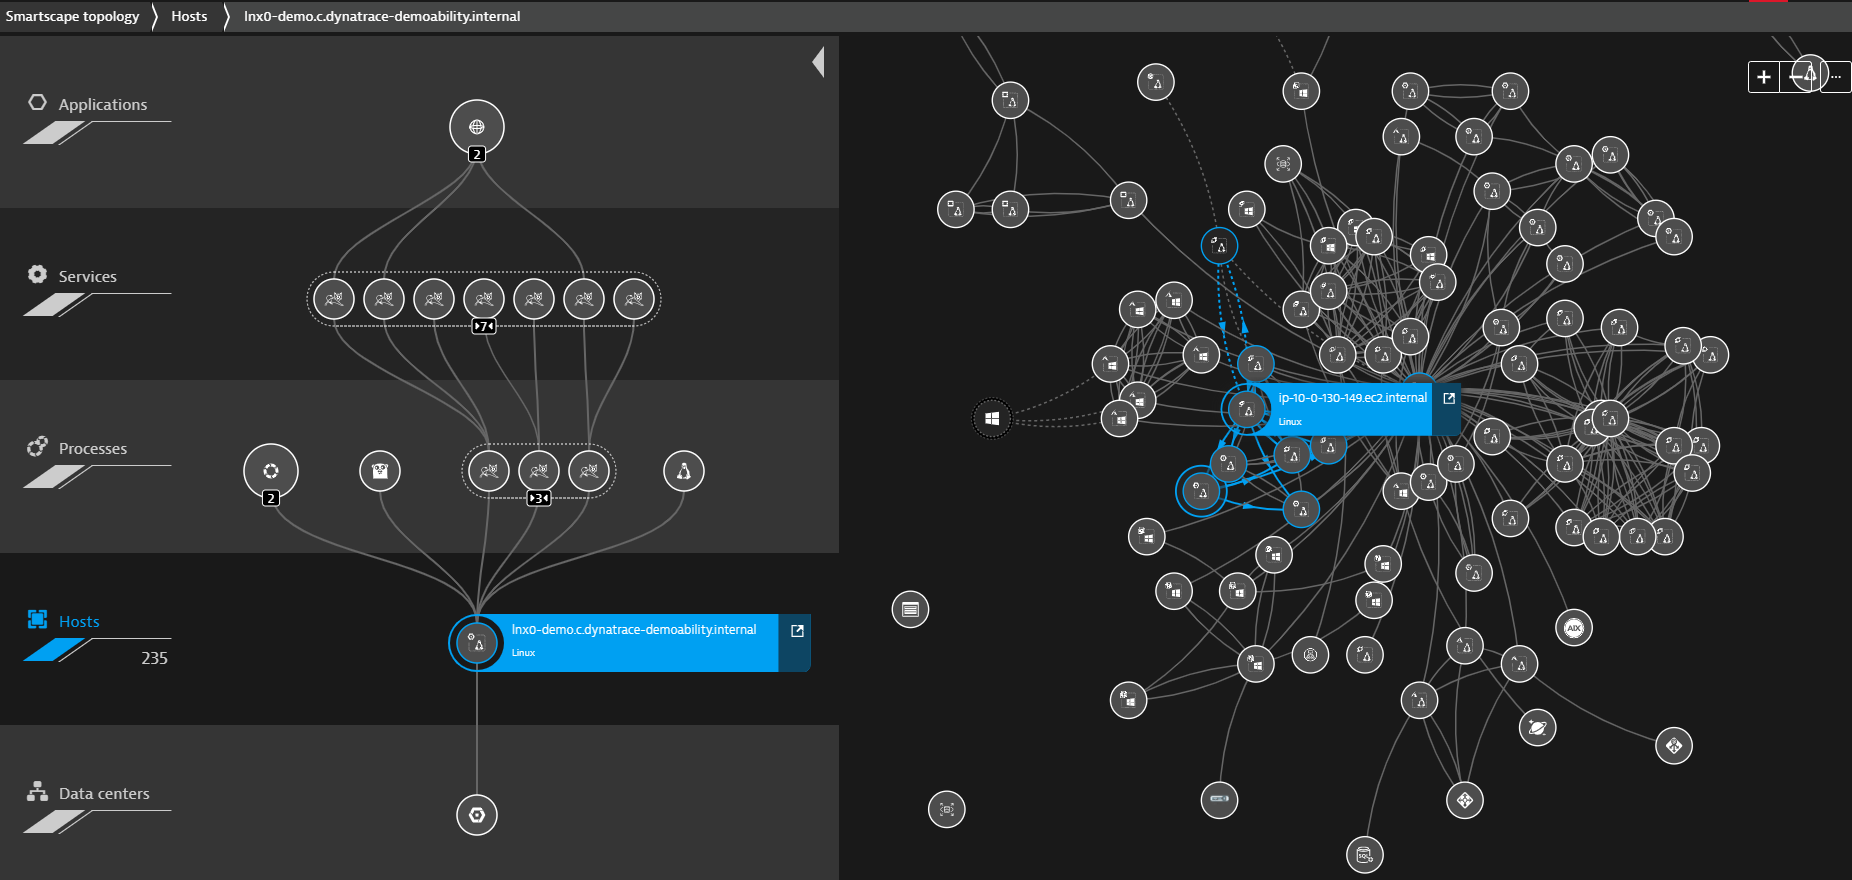
Dynatrace Application and Microservice Performance Monitoring
Dynatrace helps you ensure distributed end-to-end hybrid cloud tracing through automated instrumentation and monitoring, optimise service performance, innovate faster and collaborate efficiently to create more value with less effort.
Automatically monitor your cloud-native environment
Automatically capture transactions at every level, from the front-end to the back-end to the code level. Analyse and optimise the performance of your applications for an improved user experience.
In addition to on-premise or hybrid applications, Dynatrace also detects and monitors all dynamic microservices workloads running. e.g. in containers on Kubernetes. See how these communicate with each other and identify problematic services.
Dynatrace APM enables:
• front and back-end availability and performance analysis,
• distributed tracing,
• automatic root-cause analysis at the code level,
• automatic monitoring of cloud-native workloads and microservices,
• full-stack monitoring
↑↓ Navigation: Application Protection | Business Analytics | Cloud Automation | DEM | Infrastructure Monitoring | Kubernetes Optimization with Keptn
Keptn - the Austrian pocket knife among orchestration tools
Keptn's event-driven architecture can be integrated into Dynatrace with little effort and extended as needed. It provides a central platform for the automated delivery of applications based on cloud-native micro-services.
Kubernetes Optimisation with Dynatrace Keptn
With the Keptn tool developed by Dynatrace, you can optimise any Kubernetes cluster with minimal effort. Keptn acts as a central control plane and binds the priority tool APIs via standardised events. In addition, every transaction is visualised by Keptn as a trace, making every change easily traceable. This takes you another step towards NoOps.
The integration of Keptn and Dynatrace offers you:
• Continuous Delivery with potential for great scalability,
• a robust software delivery pipeline with self-repairing workflows,
• ease of use through declarative language,
• uncomplicated maintenance,
• a high level of transparency.